November 24, 2012
Radio Astronomy Group Meeting – 24 November 2012
Report by: Grey Lipley

The Radio Group gather around Clive’s laptop to view the VLF data
Two solar flares have been detected by the Flamsteed VLF receiver. – M1.7 on 20 November at 12:41UT and M3.5 on 21 November at 15:30UT. Both have been verified using data from the internet including stunning video footage.
Both Mike and I were slightly concerned that we might not have enough to talk about at this, the fourth Flamsteed Radio Astronomy Group meeting. I’m delighted to say we were both wrong…
Adrian had kindly let me know in advance that he was unlikely to attend and sent his apologies. Our main topic of conversation was therefore going to be about the newly acquired VLF equipment housed in Clive’s garden observatory, known as “the shed“.
As usual I began the meeting with a roundup of news and although we had relatively little information at the time, suggested that the Radio Group might like to be involved in Stargazing Live. I don’t think they needed much persuasion and I am delighted that since then Mike and I have received many offers of help from Flamsteed Members covering all aspects of astronomy.
We talked briefly about our hopes and aspirations and I assured the group that we have the full support of the Royal Observatory, in particular the Education Department. This led to a discussion about the relationship between radio and visual observation of the Sun. Given my particular interest I didn’t want to push this topic but everyone seemed keen to embrace the concept of using both to make radio findings less abstract.
This encouraged us to consider which other heavenly objects we could study and present visually as a way of promoting future findings. The Moon was the strongest candidate although someone sensibly asked how this was possible. It was explained that as our nearest neighbour is inert, we would be receiving radiation reflected from the Sun. Jupiter was also suggested, followed by other objects more distant. As this subject is to an extent being researched by Adrian, we decided to pause and resume the conversation when he is next able to be with us.
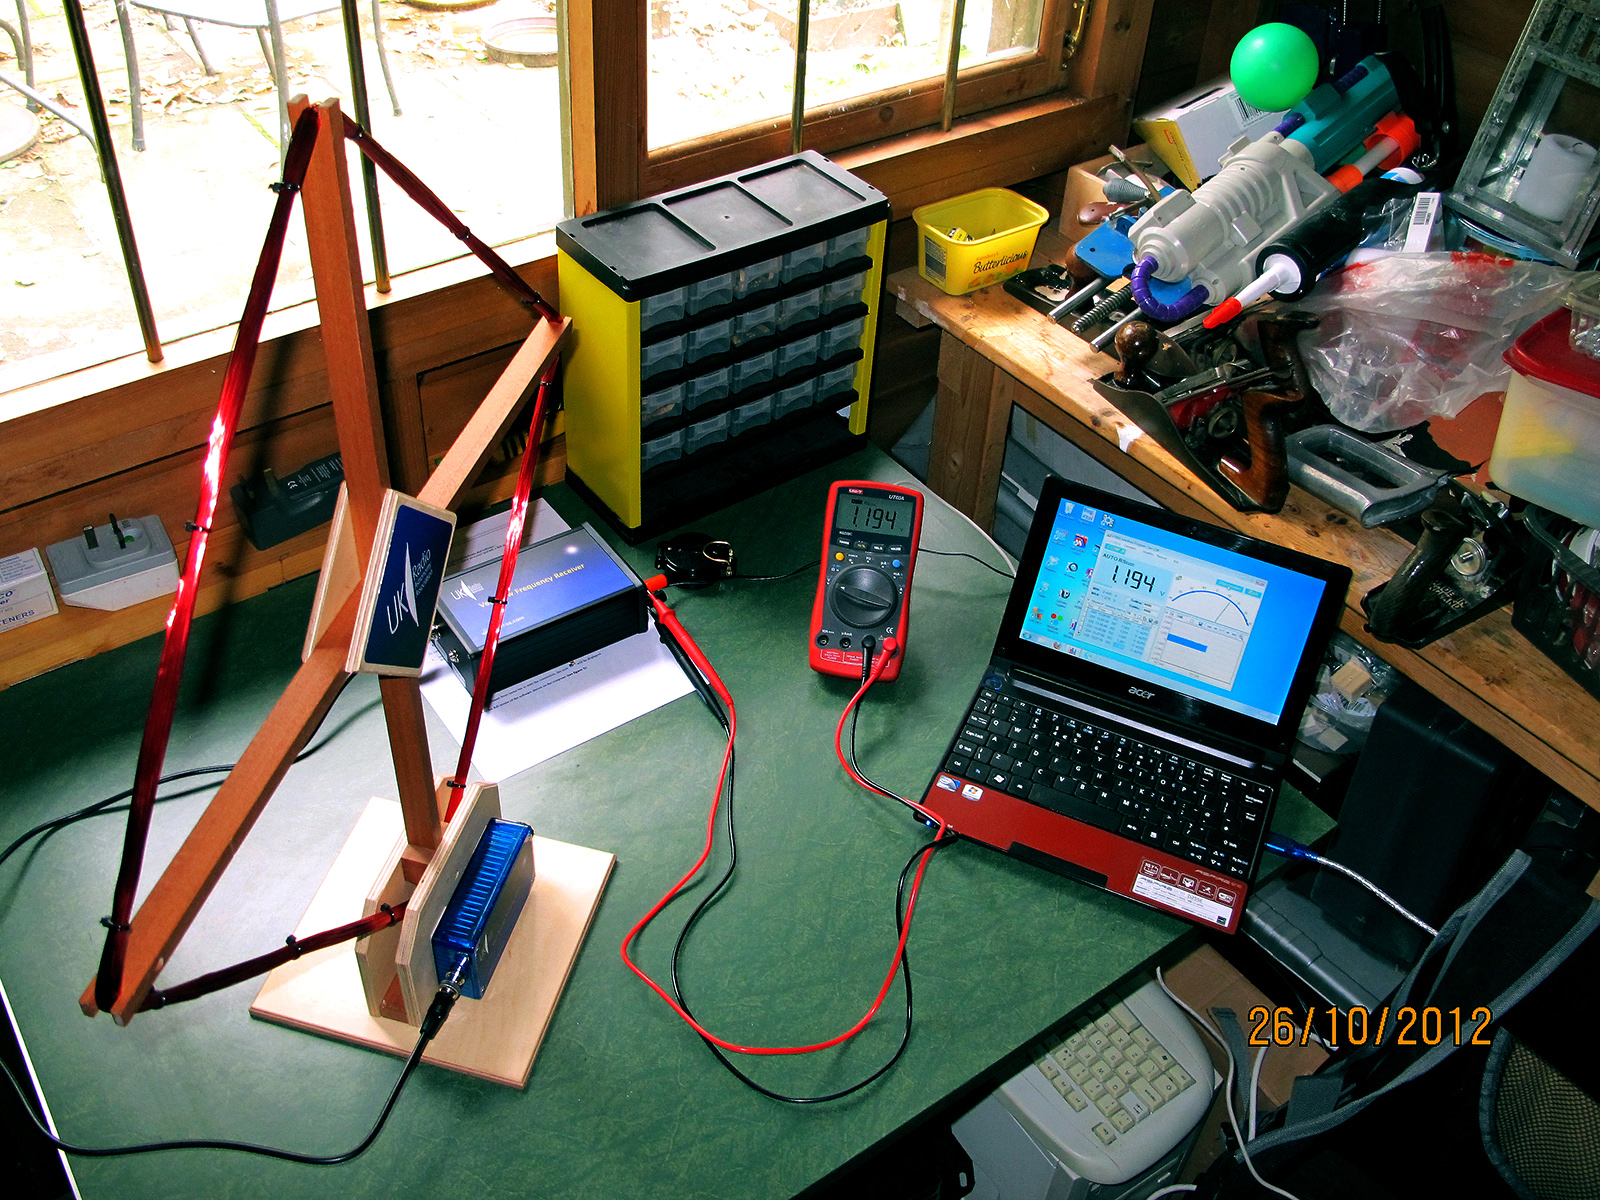
And so our attention turned to Clive and any findings he had made using the VLF equipment. He looked somewhat apprehensive until I offered words of encouragement knowing he had plenty to tell us. With the various pieces of equipment connected on the vast table, we traced the sequence of receiving a signal with the VLF Loop Arial, through the Very Low Frequency (VLF) Receiver and discussed how the data is stored in the UKRAA Controller. Connected to a PC we were able to see how the specialist software was able to interrogate the stored information and display it in a number of different ways.

VLF receiver data showing clear ‘shark fin’ dip at time of M1.7 solar flare
The two graphs presented as part of this report show characteristic peaks and troughs but one spike in particular was of interest on both sheets. Recognising these as the result of possible solar flares, Mike reached for his iPad and within moments was able to confirm that activity had indeed been recorded on the same dates at corresponding times. This caused great excitement as it meant we, or rather Clive, had recorded verifiable data. As though that we not enough, Mike then produced dramatic recorded video footage of both events bringing them vividly to life.
We agreed that combining our findings with other visual material, such as video, would be a good way of tying together physical events on the Sun. This would supplement other more obscure information showing Sudden Ionospheric Disturbances (SID). Both events recorded here show the characteristic shark fin shape of a flare related to SID, though the event on 20 November is clearer than that on 21 November, possibly because the latter event occured close to sunset.
To quote Clive’s analysis of the data “the data for the 20th Nov clearly shows the characteristic shark fin shape of a flare related SID. Its negative excursion (as opposed to the positive excursion I’ve seen published) is, I believe, due to the relatively close proximity (approx 540km) of the Ramsloh transmitter. At this distance the ground wave is still dominant. However, in data for the 21 Nov, the SID is not as easy to interpret. The overall shape of the event matches that of the X-ray flux data from the GEOS satellite, but in a positive excursion from the “normal” trace. As I hope you can see, a small negative excursion does however occur, superimposed on this positive excursion co-incident with the flare peak recorded by the satellite. Could this anomaly be due to the fact that normal day time conditions are coming to an end as sunset occurs at the transmitter site?“. An interesting debating point.
To round the meeting off I read from the BAA’s spiral bound book, Observing Guide to the Sun. This relatively inexpensive publication is packed with information and contains advice for both indirect (VLF) and direct (VHF) radio observation. The text lists wavelengths and parameters for observing specific regions of the Sun together with particular events.
This revived the conversation earlier regarding Adrian’s work and use of the satellite dish. Roger had read that it was advisable to paint the surface of this matt black as white reflects radiation from the Sun to the focal point. As a result the LNB can heat up and give distorted or false readings. Roger kindly offered to paint the dish for us. Those gathered around the table then broke off to form smaller informal discussion groups before leaving.
My thanks to everyone involved for yet another very productive meeting. To Clive Inglis for bringing the VLF equipment to the ROG for us to see and to Mike for finding the videos that confirm our data. I would also like to thank the UK Radio Astronomy Association for making the equipment available for purchase and for their advice and enthusiastic response to our work.
To see active footage of the Sun placed alongside data gathered using the Flamsteed VLF equipment please go to: http://www.youtube.com/watch?v=xWVR8u_LzGg or see the video below
By Grey Lipley
Pictures from the meeting by Grey Lipley and data analysis by Clive Inglis:


Posted under: Flamsteed, Meeting Report, Radio Astronomy
You must be logged in to post a comment.